


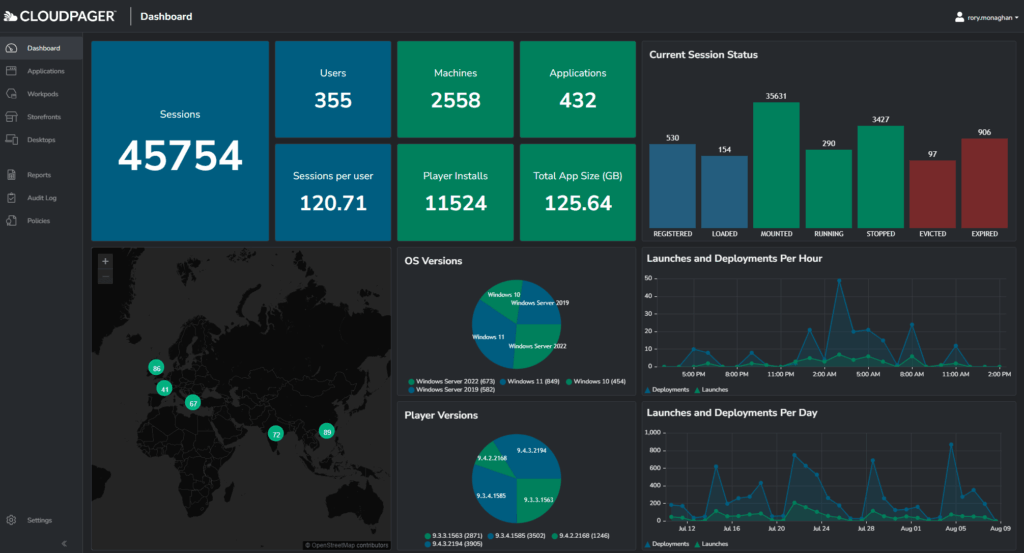
The new Dashboard feature within Cloudpager provides administrators with a single pane of glass to review application and desktop session information, such as desktop session status, critical application launch and deployment data, the growth of your organization, and more.
Easily Review Application Deployment and Desktop Session Data
The Dashboard feature provides an intuitive yet comprehensive set of metrics, including total number of sessions, number of users, number of machines, number of applications, etc. This can be useful to measure the level of activity in your environment and to track growth at a glance. Additionally, there is a handy user and session growth chart for this purpose too.
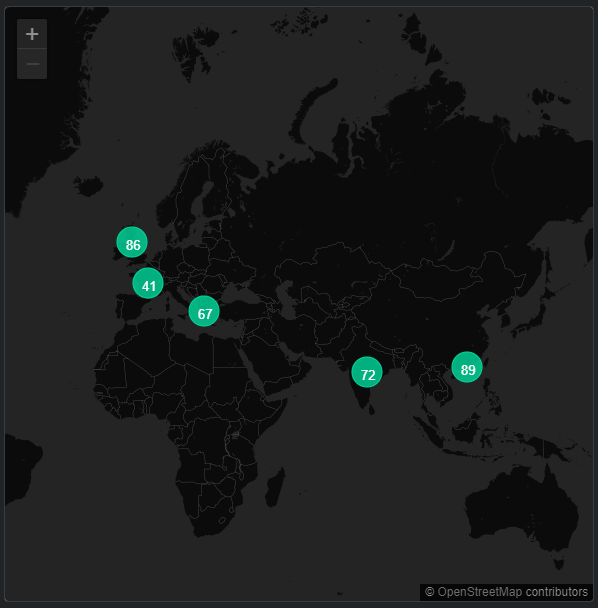
The dashboard also plots out the location of your users on a map, this can be useful for keeping track of where users are based but potentially also for anomaly detection purposes to discover users who may be connecting from locations that are unexpected and perhaps not permitted by your security team.
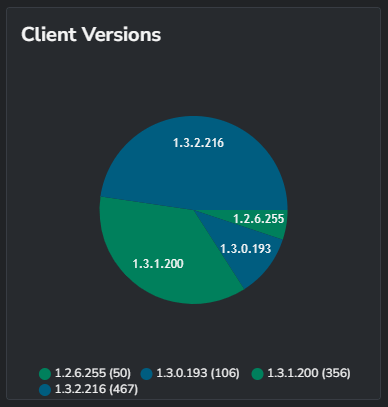
Immediately Determine Product and Windows OS Versions
Reviewing end user desktop software has never been easier. Your Cloudpager Dashboard tracks what versions of the Cloudpager Client employees are using. This simplifies tracking client upgrades and ensuring compliance throughout your organization by standardizing on the proper version.
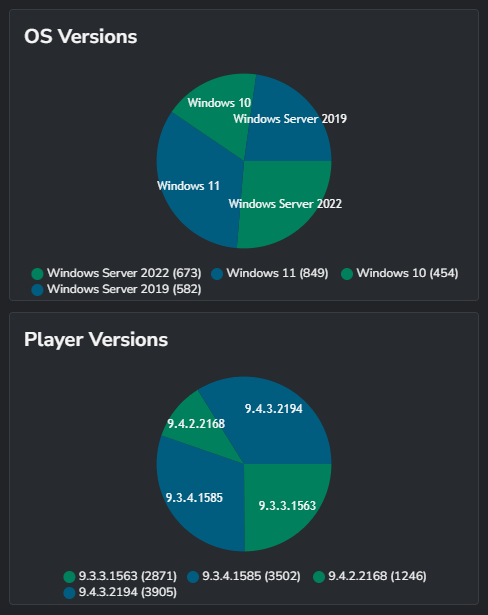
There are similar charts for the Cloudpaging Player and Windows operating system version. The later is particularly useful amid an OS migration, such as Windows 10 to Windows 11. As you can see in the example below (see Figure 4), this macro-view enables you to immediately discern end users are utilizing a combination of Windows 10, Windows 11, Windows Server 2019, and Windows Server 2022 operating systems. As far as the versions of Cloudpaging Player being run, this organization is running versions 9.3.3.1 and later.
Monitor Application Health in Real Time
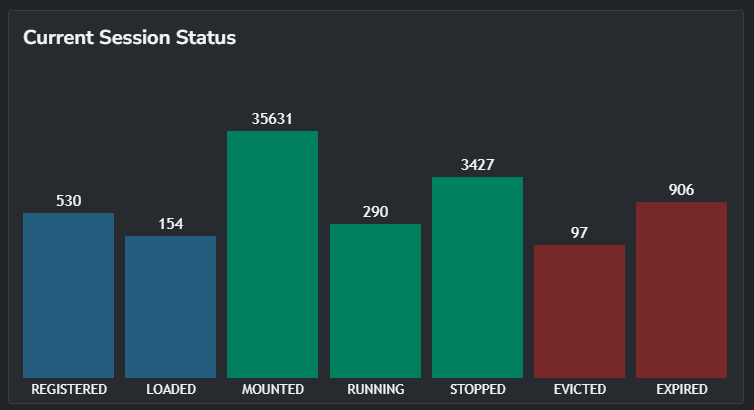
Being a modern application container orchestration platform, Cloudpager provides the most pertinent data relating to the health of applications in your respective end user desktop environments, as well as the progress of your deployments. Dashboard has this covered, showing application statuses such as how many applications are mounted, stopped, running etc.
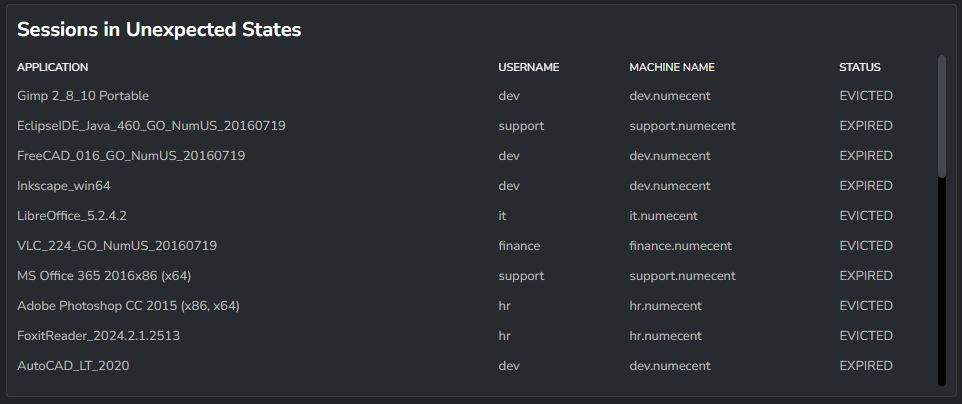
Just as important, it shows which applications are in an unexpected state such expired, evicted, or error. This could be useful to detect individual problems or systemic failures, if they occur.
Track Application Deployments and Launches
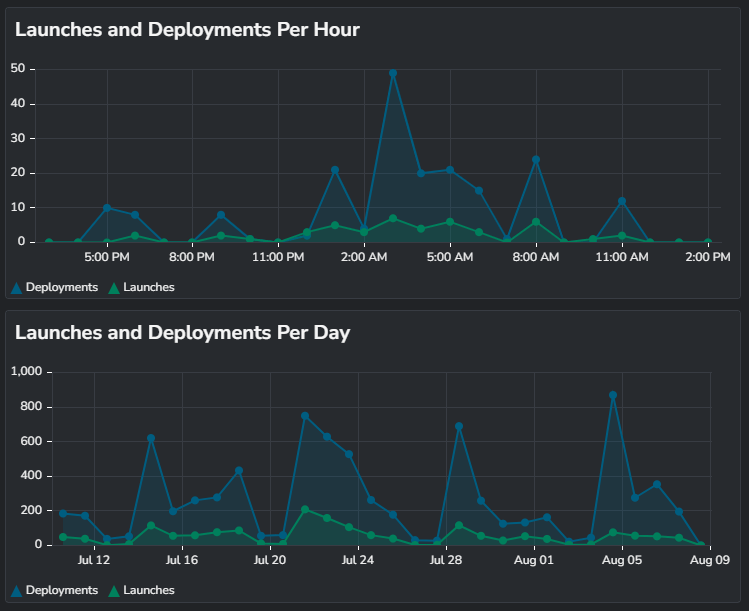
Application launches and deployments are displayed per day and per hour. These charts allow administrators to quickly discern benchmarks for their respective organizations. This enables them to more easily detect whether there is something abnormal on a given day or hour.
Identify What Applications Are Most Critical To Your Business
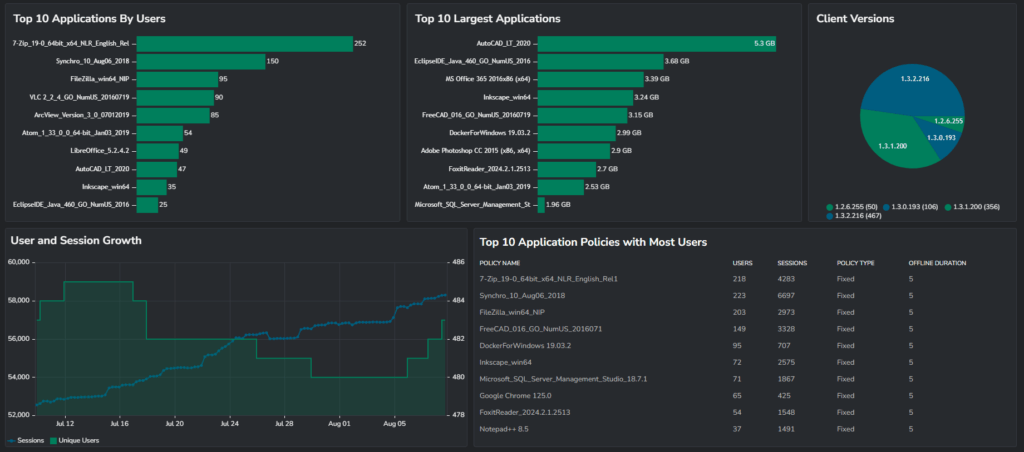
The Cloudpager Dashboard provides insights into application consumption, including the most frequently deployed applications, the largest applications, and the application policies being exercised the most (e.g., how long an application is allowed to be run offline). Data on User and Session Growth enable you to monitor the growth of your organization, as I alluded to in the introduction of this blog.
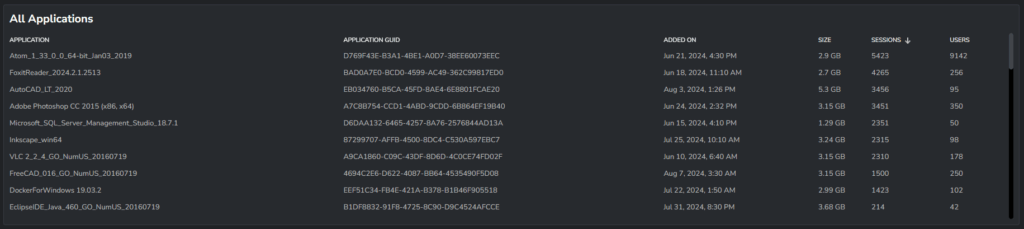
Last but not least, at the bottom of the Dashboard tab there is a general application list. As the name suggests, this list shows all applications in your Cloudpager tenant, including how many sessions and users applications have been deployed to, the size of the applications, what date the applications were added to the Cloudpager administrative console, and each application GUID.
Conclusion
As an administrator, this Dashboard feature is exciting. Reviewing live data provides peace of mind that services are functioning as expected. The Dashboard complements our existing Reports feature wonderfully, as well. Administrators can continue to extract historical data from the Reports as required, while using the dashboards as a day-to-day data visualization and insights tool. We are excited to bring this feature to you and we hope you’re excited too.
See Cloudpager in Action!
Want to see what Cloudpager can in a live setting? Request a demonstration with our Solutions Architects and see the power of extending DevOps capabilities to the management of Windows desktop applications with our groundbreaking container technology.


